06 October 2025
Top line:
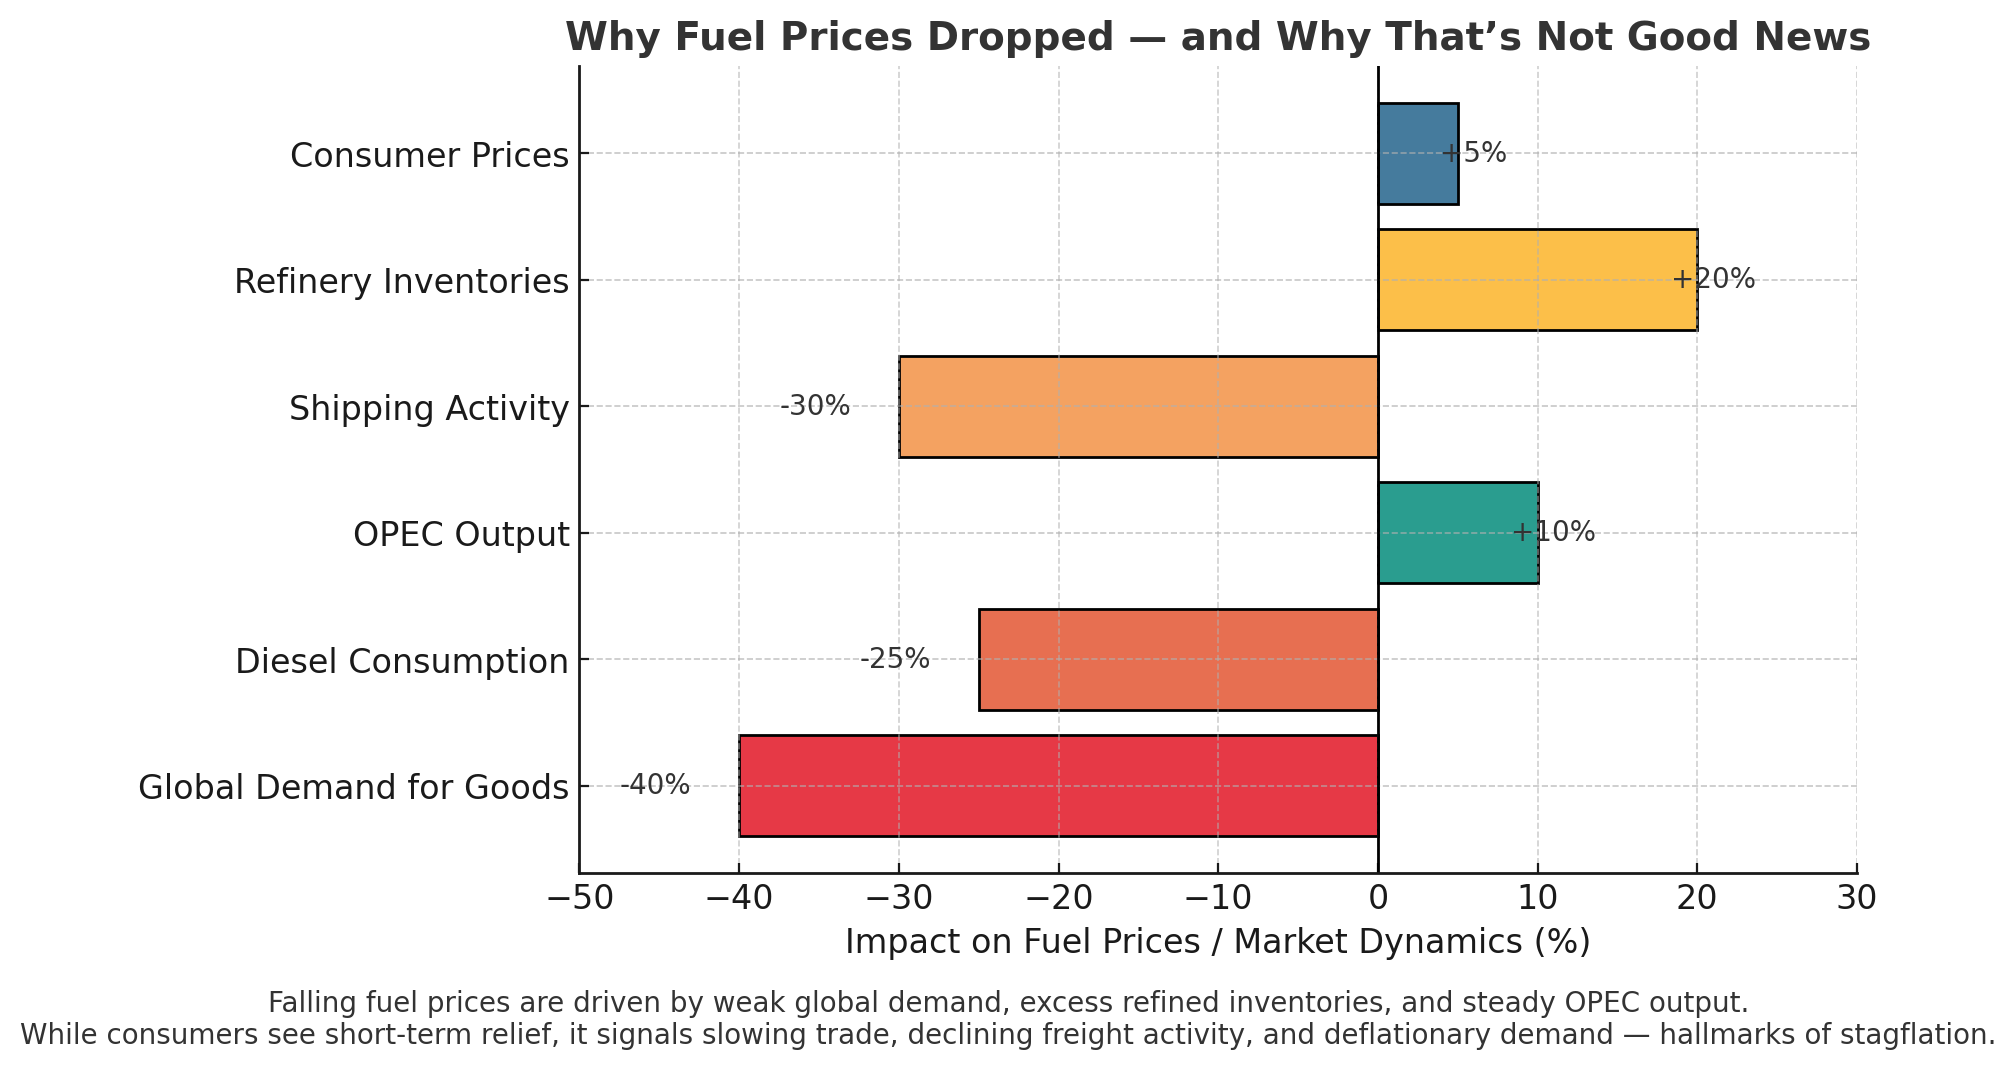
Have you noticed gas prices dropping lately? While this might seem like good news, what’s behind the dip is more troubling. Global demand for diesel, the fuel that keeps freight, shipping, and construction moving, has weakened as trade and manufacturing slow mostly due to tariffs but also global uncertainty as to the direction the US is heading politically. The result is a glut of refined fuel, and OPEC shows little appetite for cutting production. Meanwhile, the cost of goods is still rising as tariffs and supply chain fragility feed through the system. Shipping costs are easing, but they’ll likely offset only about 20–30% of overall inflation pressure over the next 6–12 months, and only if tariff tensions don’t escalate. A limited trade deal with China early next year could help, but if Beijing continues redirecting exports and investment toward India and other BRICS partners, the U.S. could see further job losses and industrial drag instead of recovery. This week job declines and flattening wages along with the host of metrics we follow has ticked up the risk of Stagflation to 55% (up 10%), recession 30% (flat) and neither at 15% (down10).
OF NOTE: I have one more thing I want to point out that is forecasted in our stagflation index and that is the price of gold and what that actually means as the dollar's value trends lower and the uncertain geopolitics. The last time gold was this high was 1979-1980 where inflation soared to 13%. That led to a deep recession as the Fed chair had to raise interest rates over 20%. It took 6 years to really break the lock on stagflation. The issues being signaled now are mirrored to those leading up to that financial crash.
Details
As of this week, our composite model points to a U.S. economy caught in a tightening vise between inflationary policy and weakening demand. Private labor data from ADP, Indeed, and LinkedIn show hiring slowing and job postings declining, while real wages have flattened—eroding consumer strength. Housing is soft, with pending sales down and mortgage rates stuck near 7%, signaling affordability stress and stagnant activity. Used car prices are falling even as repair costs climb, illustrating how disinflation in goods is offset by persistent services inflation. Consumer demand and business output continue to weaken: Adobe’s online spending data is flat, and S&P Global’s PMI sits below 50, indicating contraction. Freight and hotel data confirm a slowdown in logistics and tourism, while corporate credit spreads are widening and volatility remains elevated, suggesting growing investor unease. Tariffs now average roughly 18%, and new executive orders—especially the 100% chip import tariff and deficit-expanding H.R.1 tax cuts—are adding structural inflation pressure. Oil and shipping costs have dropped, but largely due to weaker global trade, not improved efficiency, echoing a classic stagflation signal. Meanwhile, the administration’s restrictions on H-1B visas and cuts to research funding are driving away high-skill talent and undermining long-term R&D capacity, compounding structural decline. Together, these forces produce a base-case forecast of 55% probability of stagflation, 30% risk of recession, and just 15% chance of a soft landing, reflecting an economy still standing—but on increasingly uneven ground.
⚙️ 1. Labor & Wage Signals (ADP, Indeed, LinkedIn)
Hiring slowdown: ADP private payrolls trending downward for three consecutive months.
Job postings: Indeed index down ~15 % YoY; LinkedIn hiring rate continues to fall.
Real wages flat: Wage growth running below even private inflation proxies → weak consumer power.
📉 → Supports stagflation (low growth + sticky prices).
🏠 2. Housing (Redfin, Mortgage News Daily)
Pending home sales: Down ~7 % month-on-month; active listings up → demand evaporating.
Mortgage rates: Still near 7 % (30-yr fixed), crushing affordability.
📉 → Signals stagnation; price stickiness adds inflationary persistence.
🚗 3. Autos (Manheim, CarGurus, CCC)
Used-car prices: Off ~5 % YoY → demand weakening.
Repair costs: Up ~12 % YoY → parts inflation.
📊 → Dual effect: headline CPI benefit from falling sticker prices, but services inflation from repairs.
💳 4. Demand & Prices (Adobe Digital Economy, S&P Global PMIs)
Online consumer spend: Flat to slightly down since July.
PMI: S&P Global Composite = 49.6 (< 50 = contraction).
📉 → Weak demand, declining new orders = growth drag.
🚚 5. Logistics & Tourism (DAT Trendlines, STR/CoStar RevPAR)
Freight rates: Down > 20 % YoY.
Hotel RevPAR: Flat; occupancy sliding → tourism slowdown.
📉 → Transport demand contraction confirms global trade softness.
📈 6. Markets (ICE BofA HY OAS, VIX)
Credit spreads: Widening (≈ +40 bps since August).
VIX: Elevated but not spiking → investor unease, not panic.
📉 → Caution phase, typical pre-recession behavior.
🏛️ 7. Policy Shocks (Tariffs, EOs, H.R. 1)
Effective tariff rate: ~18 % (from 2.5 % pre-Trump II).
EO on chips: 100 % tariff on imported semiconductors → cost inflation.
H.R. 1 tax bill: Inflationary (large cuts + deficit expansion).
📈 → Adds structural inflation pressure even as demand softens.
⛽ 8. Commodities & Shipping (WTI, Baltic Dry Index, Drewry WCI)
WTI: ≈ $73/bbl (–12 % m/m).
Diesel & freight: Falling; Baltic Dry Index –8 % m/m.
📉 → Deflationary in goods but signals demand collapse = stagflation risk.
🧮 9. Stagflation Index (Inflation vs Growth vs Productivity)
Weighted composite of:
S&P Global PMI < 50 (growth negative)
Private inflation proxies > 3 %
Productivity trend ≈ 0.6 % QoQ
📊 → Index reading = 0.67 (> 0.5 = stagflation zone).
🧱 10. Structural Decline Tracker (R&D, Talent Migration, Institutions)
H-1B EO + research cuts: Bleeding skilled labor → tech & medicine R&D erosion.
Capital flight: VC funding –40 % YoY.
Institutional integrity: Downgraded from A– to BBB on our internal scale due to politicized agencies.
📉 → Long-term drag on innovation and growth potential.
📊 Model Summary
The above feed into a dynamic model balancing price momentum, output gap, and institutional drag.
Right now:
Inflation metrics (tariffs + services + wages) → upward pressure.
Growth metrics (PMI < 50, housing weak) → downward pressure.
Net result = Stagflation base case (55 %), Recession lag case (30 %), Soft-landing tail (15 %).
Notes on S&P and the over valuation of the Stockmarket : the Trump administration highlights the growth of the Stockmarket but here are some things to keep in mind.
1. The S&P isn’t “the economy.”
Roughly 40% of S&P 500 revenue comes from outside the United States, and much of that is denominated in weaker currencies. As the dollar softens, those overseas earnings translate into fatter profits in dollar terms — a purely opticalgain. It makes earnings look strong even when global demand is soft.
2. AI and a handful of mega-caps are carrying the index.
Seven or eight companies — Apple, Microsoft, NVIDIA, Amazon, Meta, Alphabet, and a couple of AI-adjacent chip or cloud firms — are responsible for nearly all the S&P’s growth this year. Strip those out, and the rest of the index is flat or negative.
Investors are crowding into what they think are “safe innovation bets” — a belief that AI, automation, and cloud infrastructure will drive the next productivity wave. That’s speculative optimism, not broad economic health.
3. Corporate profits are being propped up by buybacks, cost-cutting, and pricing power — not volume growth.
Revenue growth has stalled, but companies are maintaining earnings per share by reducing headcount, slowing investment, and shrinking share counts through buybacks. It’s an accounting-driven illusion of strength. The margins look fine, but the underlying demand isn’t there.
4. Financial markets are forward-looking — sometimes blindly so.
Traders are betting that the Fed will be forced to cut rates next year due to political pressure and economic weakness. That assumption inflates valuations. Markets aren’t celebrating real prosperity; they’re pricing in future easing — a kind of pre-emptive sugar high.
5. “Asset inflation” and “real-world deflation” can coexist.
Capital is piling into financial assets because real-world opportunities (manufacturing, small business expansion, R&D) look riskier. It’s the same phenomenon seen in late 1979–1980: paper wealth rising while real productivity and wages stagnate. The S&P’s strength, paradoxically, is another sign of imbalance — money chasing safety and scarcity, not broad growth.