©Christopher Tyree, All Rights Reserved
13 October 2025
Half the Body is Failing: Why Virginia May Already Be in Recession
[the Balance Sheet is based on a unique algorithm developed after Trump fired the head of BLS after they shared a bleak jobs report—therefore we can no longer fully trust government reported data] This summary is an output of that algorithm with key inputs and prompts given news over the last week. Here is October 13th, 2025.
The headlines arrived with a dull thud last week: Nearly half of U.S. states are already in recession, Moody’s Analytics warned. The phrase barely rippled the markets, already drunk on AI optimism and algorithmic sugar highs. But for anyone paying attention to the cells of the real economy — the wages, the trucks, the small shops, the families — the news felt less like a shock than a confirmation of what our bodies already knew.
Moody’s call isn’t built on Wall Street hunches. It’s based on a collection of state-level “coincident indicators” — local employment, income, and output trends that together tell you whether the heart is beating faster or slower than the national pulse. When those indicators contract, it means the cells are starving even if the patient still smiles for the photo. And by that measure, nearly half the states — including Virginia — are quietly sliding into contraction.
Virginia’s inclusion in the list is telling. On paper, the Commonwealth looks strong: a tech corridor buzzing in Northern Virginia, federal contractors with six-figure salaries, and a stream of defense money flowing down from D.C. But if you zoom out from the spreadsheets and look at the living organism beneath, you see something else: a body that’s running out of breath.
The Weldon Cooper Center at the University of Virginia estimates the state will lose roughly 32,000 jobs in 2025, driven largely by a cooling federal sector and a slowdown in private hiring. In rural Virginia, the slowdown is even more visceral. Hardwood exports to China have fallen sharply as the trade war grinds on. Farmers who once sold soybeans to Shanghai are staring at empty silos. Timber demand has slumped, and truck freight through the I-64 corridor is slowing. In the global body economy, Virginia’s lungs — trade and transport — are wheezing.
Meanwhile, the housing market, Virginia’s skeleton, is creaking. Mortgage rates hovering near seven percent have frozen buyers in place. Inventory is rising in cities like Richmond and Charlottesville even as prices soften in rural counties. Construction has stalled. Builders are backing away from speculative projects. The real estate agents whisper it quietly: We’re back to 2011 volumes.
Even the blood flow — capital — is tightening. The Virginia Secretary of Finance’s November 2024 GACRE Reportwarned that the state’s revenue growth had “slowed markedly,” with weaker individual income taxes and a contraction in corporate receipts. Local banks are seeing higher delinquencies, especially in commercial property loans. The “microvasculature” of small-town credit is starting to clot.
And then there’s the immune system — the ability to heal. Normally, Virginia can fall back on the federal government for stability. But that safety net is fraying. Layoffs in Washington are bleeding into Fairfax and Arlington. A government shutdown looms, threatening to freeze paychecks and delay contracts. If that happens, the impact on the state’s service economy will be immediate and sharp. “Flying blind amidst heavy fog is a dangerous proposition,” Gregory Daco, chief economist at EY-Parthenon, warned this week in the New York Times, referencing how a shutdown would cripple data reporting. That same blindness extends to policymakers, who will be trying to steer the ship without radar.
So, yes — by any cellular measure, Virginia is in a localized recession. Maybe not a headline one, but a lived one. The heart still beats, but the limbs are cold.
At The Balance Sheet, our model reads this differently from the conventional economists. GDP, like a body temperature, only tells you so much. The real story lives in the cells: wages, freight, rents, credit, tourism, trade. In our framework, Virginia’s cellular vitality has been weakening since midsummer. Freight and timber are down. Consumer spending has flattened. Tourism is softening, with arrivals to Washington, D.C. down nearly nine percent year to date. Even optimism — the oxygen of economic metabolism — is fading.
Our Stagflation Index this week rises to roughly 60 percent, its highest reading yet. Inflation is sticky, growth is uneven, and credit stress is spreading. Recession risk rises to 25 to 30 percent, reflecting the state-level downturns now visible in data. The so-called “soft landing” narrative? Down to maybe 15 percent, if that. The traffic light on our Structural Risk Map has shifted from yellow to deep orange.
The irony is that none of this shows up in the S&P 500, which jumped 450 points Monday after a brutal Friday drop triggered by former President Trump’s threat to slap 100 percent tariffs on Chinese goods — especially rare earth minerals. The markets bounced back not because the fundamentals improved, but because traders believed the Fed would blink first. Take the AI sector out of the equation, and by any historical metric we’d already be in recession.
Economists and journalists often forget that economies are not equations; they are living organisms. The lungs of trade, the heart of credit, the muscles of labor, the bones of housing — they all depend on the mitochondria that power each cell: households, small businesses, and workers. When those mitochondria are starved, the body’s vitality fades long before the thermometer drops.
Virginia’s slowdown is not an isolated fever. It’s a symptom of a national metabolism that’s breaking down into regional imbalances — some organs still surging, others failing quietly. And unless those energy flows are restored — through productivity, wages, or trust — the body risks sliding into a full-blown stagflationary illness.
For now, Moody’s diagnosis seems right. The patient isn’t in crisis, but the color has drained from its face.
Sources:
Moody’s Analytics State Coincident Indexes (October 2025)
Axios Richmond (May 13, 2025): “Virginia Forecasts 32,000 Job Losses in 2025”
Virginia Secretary of Finance – GACRE Economic Outlook (Nov. 2024)
New York Times (Oct. 12, 2025): “A Looming Shutdown Threatens to Blind the Fed”
06 October 2025
Top line:
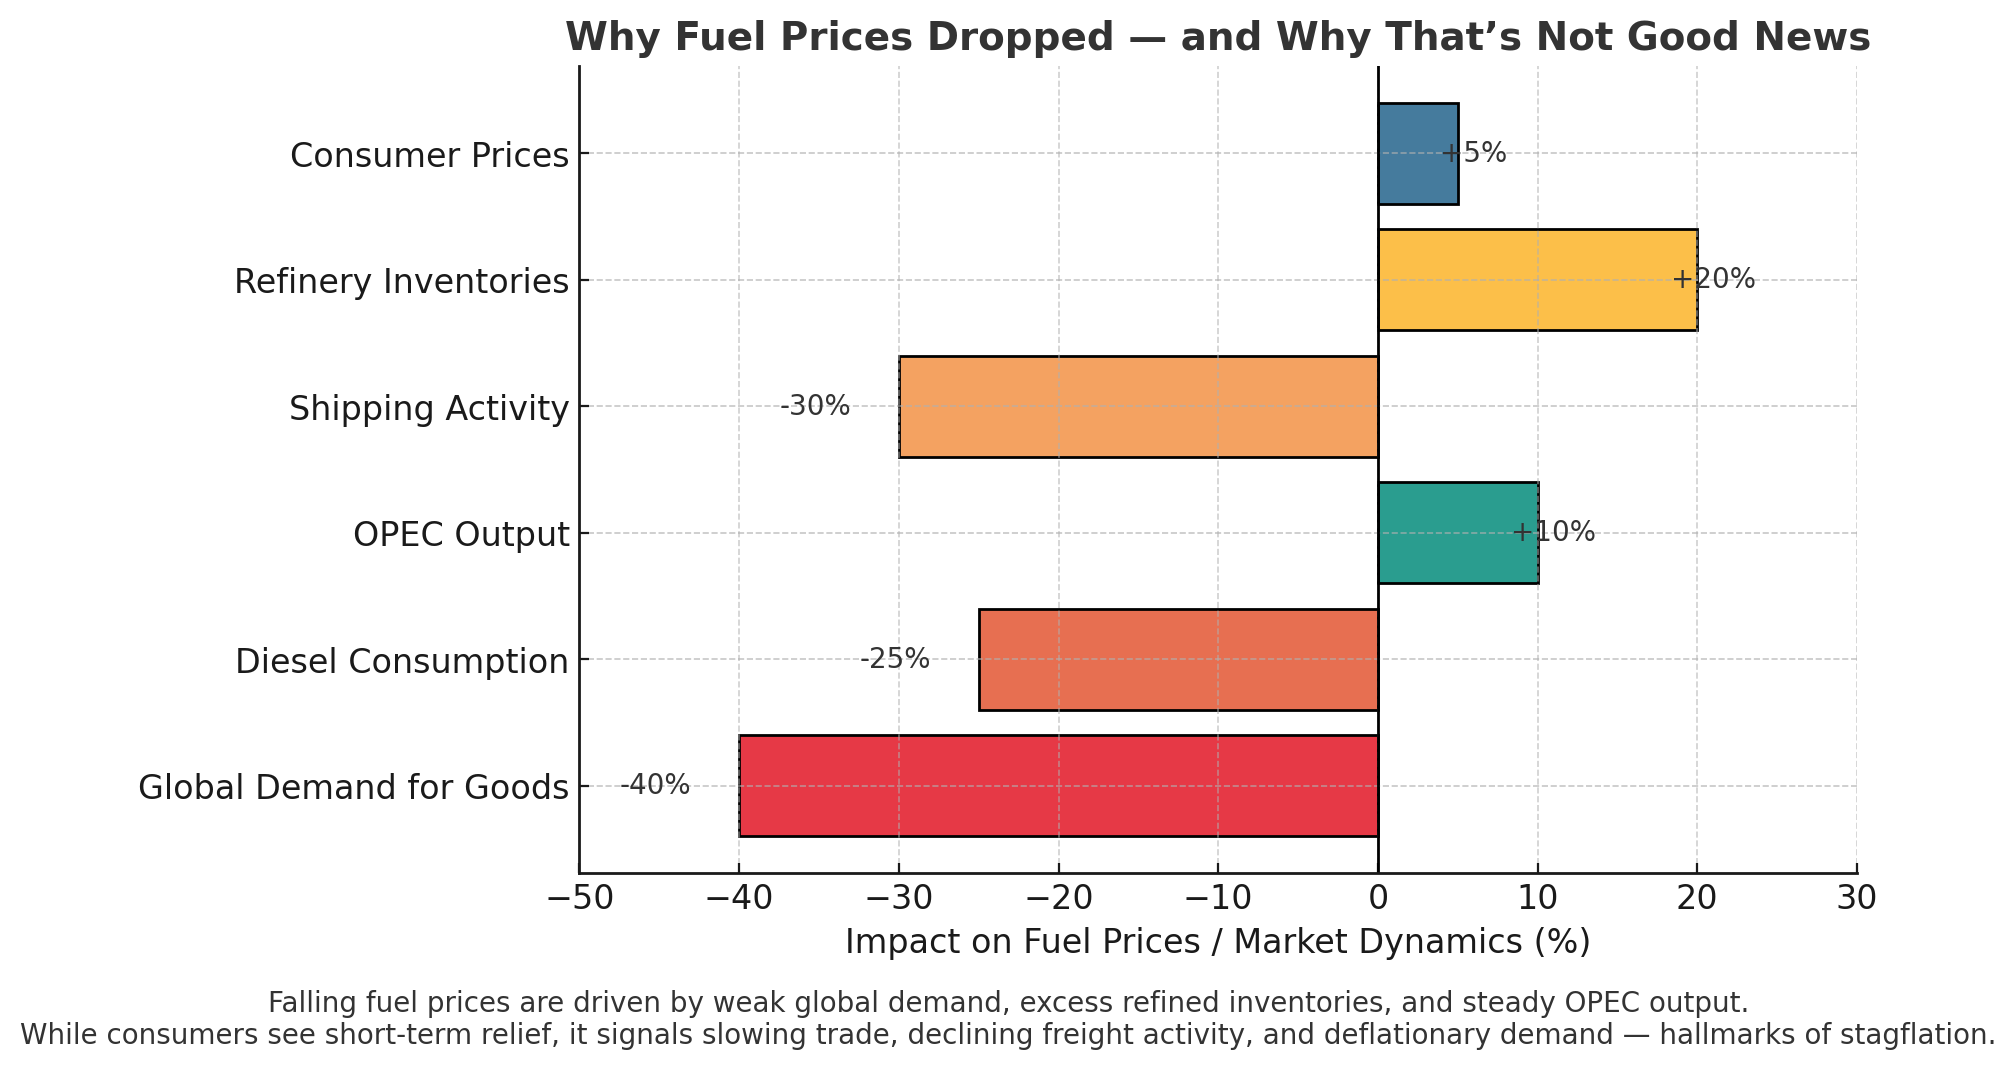
Have you noticed gas prices dropping lately? While this might seem like good news, what’s behind the dip is more troubling. Global demand for diesel, the fuel that keeps freight, shipping, and construction moving, has weakened as trade and manufacturing slow mostly due to tariffs but also global uncertainty as to the direction the US is heading politically. The result is a glut of refined fuel, and OPEC shows little appetite for cutting production. Meanwhile, the cost of goods is still rising as tariffs and supply chain fragility feed through the system. Shipping costs are easing, but they’ll likely offset only about 20–30% of overall inflation pressure over the next 6–12 months, and only if tariff tensions don’t escalate. A limited trade deal with China early next year could help, but if Beijing continues redirecting exports and investment toward India and other BRICS partners, the U.S. could see further job losses and industrial drag instead of recovery. This week job declines and flattening wages along with the host of metrics we follow has ticked up the risk of Stagflation to 55% (up 10%), recession 30% (flat) and neither at 15% (down10).
OF NOTE: I have one more thing I want to point out that is forecasted in our stagflation index and that is the price of gold and what that actually means as the dollar's value trends lower and the uncertain geopolitics. The last time gold was this high was 1979-1980 where inflation soared to 13%. That led to a deep recession as the Fed chair had to raise interest rates over 20%. It took 6 years to really break the lock on stagflation. The issues being signaled now are mirrored to those leading up to that financial crash.
Details
As of this week, our composite model points to a U.S. economy caught in a tightening vise between inflationary policy and weakening demand. Private labor data from ADP, Indeed, and LinkedIn show hiring slowing and job postings declining, while real wages have flattened—eroding consumer strength. Housing is soft, with pending sales down and mortgage rates stuck near 7%, signaling affordability stress and stagnant activity. Used car prices are falling even as repair costs climb, illustrating how disinflation in goods is offset by persistent services inflation. Consumer demand and business output continue to weaken: Adobe’s online spending data is flat, and S&P Global’s PMI sits below 50, indicating contraction. Freight and hotel data confirm a slowdown in logistics and tourism, while corporate credit spreads are widening and volatility remains elevated, suggesting growing investor unease. Tariffs now average roughly 18%, and new executive orders—especially the 100% chip import tariff and deficit-expanding H.R.1 tax cuts—are adding structural inflation pressure. Oil and shipping costs have dropped, but largely due to weaker global trade, not improved efficiency, echoing a classic stagflation signal. Meanwhile, the administration’s restrictions on H-1B visas and cuts to research funding are driving away high-skill talent and undermining long-term R&D capacity, compounding structural decline. Together, these forces produce a base-case forecast of 55% probability of stagflation, 30% risk of recession, and just 15% chance of a soft landing, reflecting an economy still standing—but on increasingly uneven ground.
⚙️ 1. Labor & Wage Signals (ADP, Indeed, LinkedIn)
Hiring slowdown: ADP private payrolls trending downward for three consecutive months.
Job postings: Indeed index down ~15 % YoY; LinkedIn hiring rate continues to fall.
Real wages flat: Wage growth running below even private inflation proxies → weak consumer power.
📉 → Supports stagflation (low growth + sticky prices).
🏠 2. Housing (Redfin, Mortgage News Daily)
Pending home sales: Down ~7 % month-on-month; active listings up → demand evaporating.
Mortgage rates: Still near 7 % (30-yr fixed), crushing affordability.
📉 → Signals stagnation; price stickiness adds inflationary persistence.
🚗 3. Autos (Manheim, CarGurus, CCC)
Used-car prices: Off ~5 % YoY → demand weakening.
Repair costs: Up ~12 % YoY → parts inflation.
📊 → Dual effect: headline CPI benefit from falling sticker prices, but services inflation from repairs.
💳 4. Demand & Prices (Adobe Digital Economy, S&P Global PMIs)
Online consumer spend: Flat to slightly down since July.
PMI: S&P Global Composite = 49.6 (< 50 = contraction).
📉 → Weak demand, declining new orders = growth drag.
🚚 5. Logistics & Tourism (DAT Trendlines, STR/CoStar RevPAR)
Freight rates: Down > 20 % YoY.
Hotel RevPAR: Flat; occupancy sliding → tourism slowdown.
📉 → Transport demand contraction confirms global trade softness.
📈 6. Markets (ICE BofA HY OAS, VIX)
Credit spreads: Widening (≈ +40 bps since August).
VIX: Elevated but not spiking → investor unease, not panic.
📉 → Caution phase, typical pre-recession behavior.
🏛️ 7. Policy Shocks (Tariffs, EOs, H.R. 1)
Effective tariff rate: ~18 % (from 2.5 % pre-Trump II).
EO on chips: 100 % tariff on imported semiconductors → cost inflation.
H.R. 1 tax bill: Inflationary (large cuts + deficit expansion).
📈 → Adds structural inflation pressure even as demand softens.
⛽ 8. Commodities & Shipping (WTI, Baltic Dry Index, Drewry WCI)
WTI: ≈ $73/bbl (–12 % m/m).
Diesel & freight: Falling; Baltic Dry Index –8 % m/m.
📉 → Deflationary in goods but signals demand collapse = stagflation risk.
🧮 9. Stagflation Index (Inflation vs Growth vs Productivity)
Weighted composite of:
S&P Global PMI < 50 (growth negative)
Private inflation proxies > 3 %
Productivity trend ≈ 0.6 % QoQ
📊 → Index reading = 0.67 (> 0.5 = stagflation zone).
🧱 10. Structural Decline Tracker (R&D, Talent Migration, Institutions)
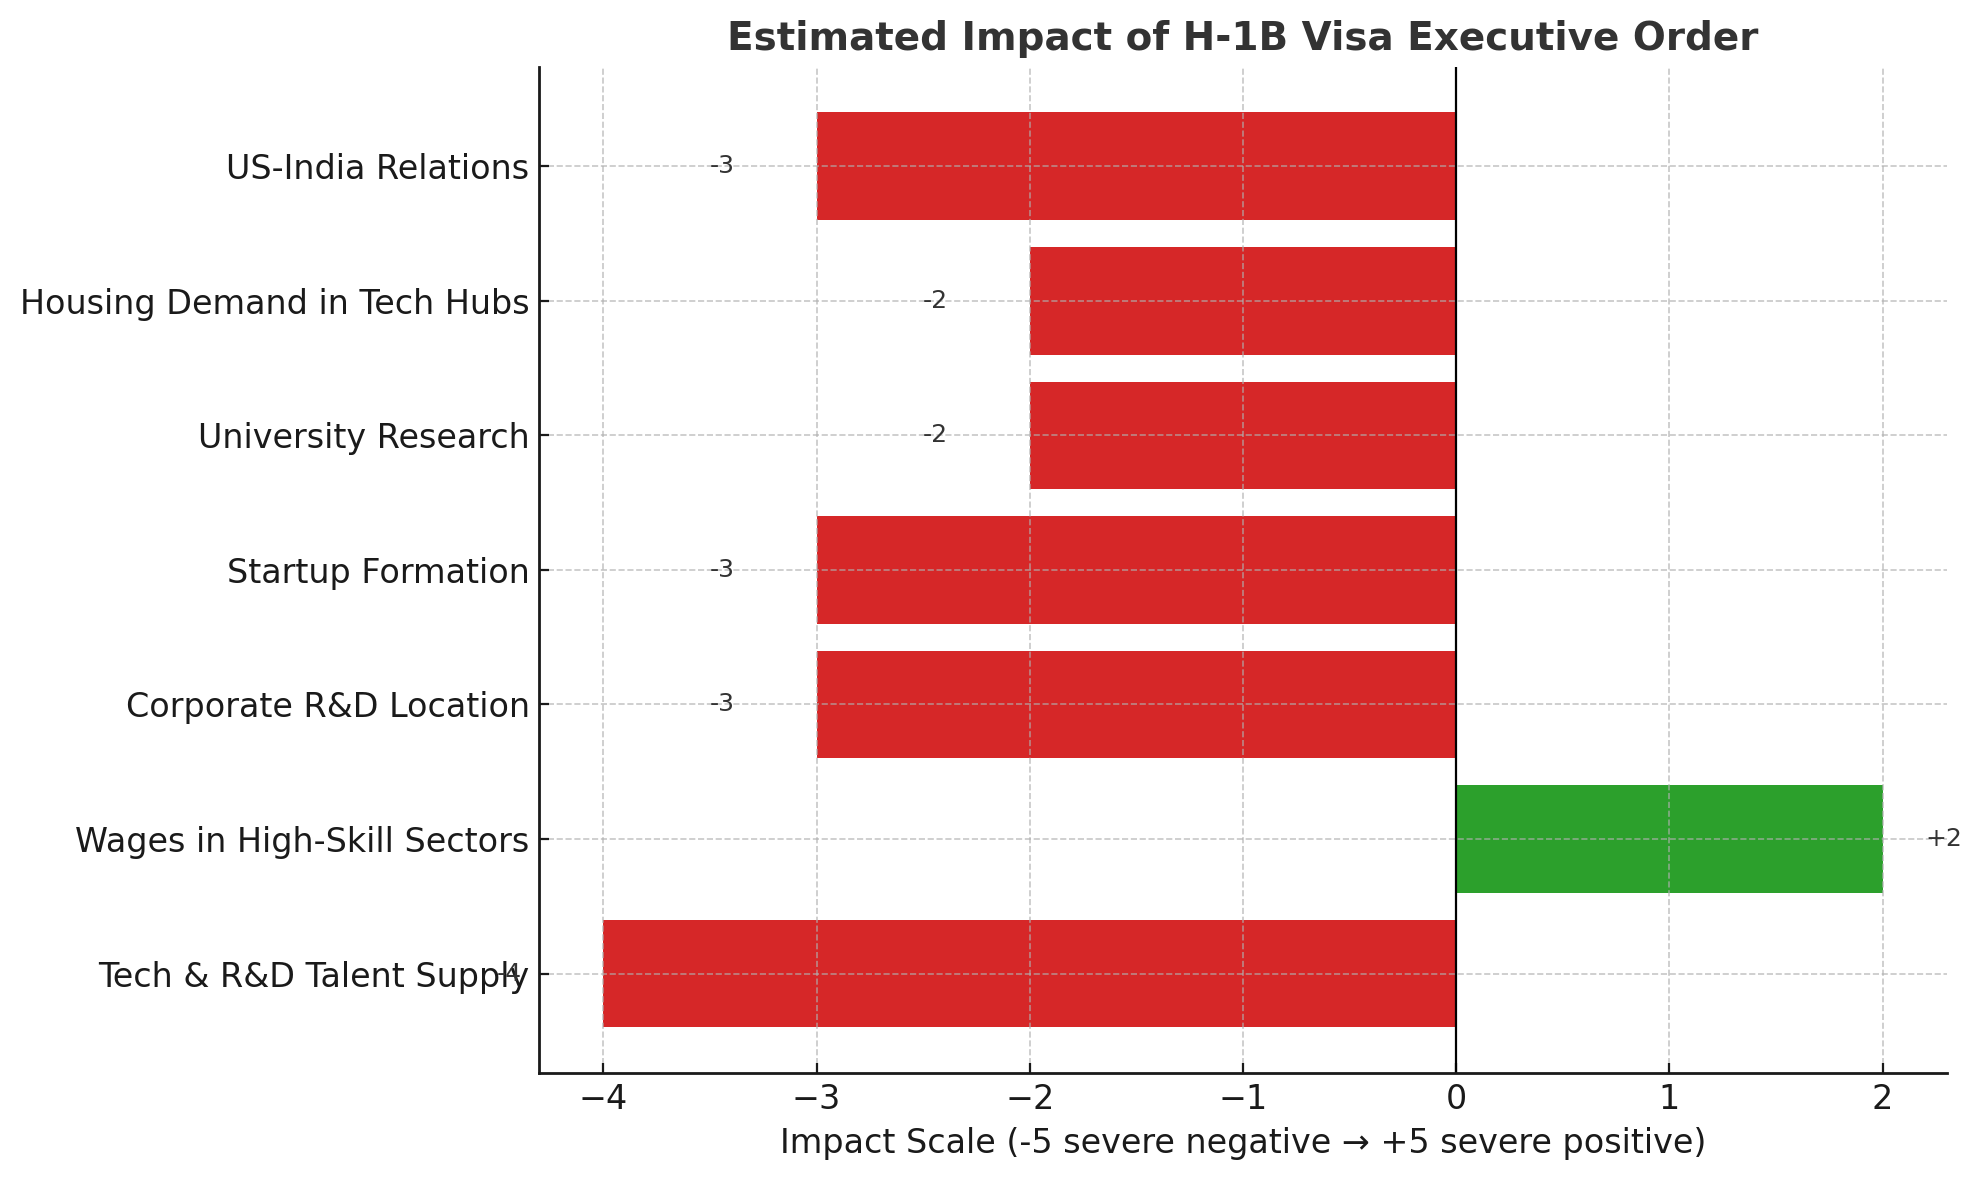
H-1B EO + research cuts: Bleeding skilled labor → tech & medicine R&D erosion.
Capital flight: VC funding –40 % YoY.
Institutional integrity: Downgraded from A– to BBB on our internal scale due to politicized agencies.
📉 → Long-term drag on innovation and growth potential.
📊 Model Summary
The above feed into a dynamic model balancing price momentum, output gap, and institutional drag.
Right now:
Inflation metrics (tariffs + services + wages) → upward pressure.
Growth metrics (PMI < 50, housing weak) → downward pressure.
Net result = Stagflation base case (55 %), Recession lag case (30 %), Soft-landing tail (15 %).
Notes on S&P and the over valuation of the Stockmarket : the Trump administration highlights the growth of the Stockmarket but here are some things to keep in mind.
1. The S&P isn’t “the economy.”
Roughly 40% of S&P 500 revenue comes from outside the United States, and much of that is denominated in weaker currencies. As the dollar softens, those overseas earnings translate into fatter profits in dollar terms — a purely opticalgain. It makes earnings look strong even when global demand is soft.
2. AI and a handful of mega-caps are carrying the index.
Seven or eight companies — Apple, Microsoft, NVIDIA, Amazon, Meta, Alphabet, and a couple of AI-adjacent chip or cloud firms — are responsible for nearly all the S&P’s growth this year. Strip those out, and the rest of the index is flat or negative.
Investors are crowding into what they think are “safe innovation bets” — a belief that AI, automation, and cloud infrastructure will drive the next productivity wave. That’s speculative optimism, not broad economic health.
3. Corporate profits are being propped up by buybacks, cost-cutting, and pricing power — not volume growth.
Revenue growth has stalled, but companies are maintaining earnings per share by reducing headcount, slowing investment, and shrinking share counts through buybacks. It’s an accounting-driven illusion of strength. The margins look fine, but the underlying demand isn’t there.
4. Financial markets are forward-looking — sometimes blindly so.
Traders are betting that the Fed will be forced to cut rates next year due to political pressure and economic weakness. That assumption inflates valuations. Markets aren’t celebrating real prosperity; they’re pricing in future easing — a kind of pre-emptive sugar high.
5. “Asset inflation” and “real-world deflation” can coexist.
Capital is piling into financial assets because real-world opportunities (manufacturing, small business expansion, R&D) look riskier. It’s the same phenomenon seen in late 1979–1980: paper wealth rising while real productivity and wages stagnate. The S&P’s strength, paradoxically, is another sign of imbalance — money chasing safety and scarcity, not broad growth.
22 September 2025
The economy is walking under its own power but only because AI is acting as a brace. Strip that away, and the underlying patient is fragile — with stagflation still the dominant concern.
The past week brought two developments that matter more than the daily market chatter: the Federal Reserve cut interest rates for the first time this year, and President Trump signed an executive order restricting H-1B visas. One was a painkiller, the other a tourniquet. Together they tell a story of an economy being propped up for now but left with less room to heal.
The Fed’s cut buys short-term relief for households and businesses struggling under high borrowing costs. But paired with tariffs that continue to raise prices, the move risks keeping inflation stubborn even as growth slows — the classic stagflation trap. Investors cheered, but the underlying imbalance remains.
Wages increase because of the scarcity of high tech labor due to the EO but also because of lack of funding to research institutions by the administration.
The H-1B order cuts deeper. For decades, high-skilled immigrants, especially from India, have powered U.S. research, engineering, and medical progress. Shutting down that pipeline means companies will push more R&D abroad and the U.S. brain trust will slowly erode. It’s the kind of decision that doesn’t register in this quarter’s numbers but shapes the country’s trajectory for decades.
Meanwhile, the foundations of resilience — housing, cars, tourism, philanthropy — are softening. Homes are lingering on the market even as mortgage rates ease. Used cars are cheaper to buy but more expensive to repair. Hotels are reporting weaker bookings as summer closes. Even nonprofit giving, long a quiet stabilizer in tough times, is showing signs of donor fatigue.
Taken together, these headlines suggest an economy that’s still standing but increasingly brittle. AI investment is holding up the frame for now, but if that spending slows or global shocks hit, the cracks could widen quickly. The path forward is less about avoiding pain and more about whether the country can absorb it without breaking.
Vitals
Pulse (Labor): ADP shows sluggish job gains (+54k), mainly in health care and AI. Indeed/LinkedIn postings are flat. Wages rising 4.4% y/y keep pressure on costs.
Blood Pressure (Prices): Tariffs and food costs remain inflationary. Relief from cheaper oil (~$63/bbl) and lower freight rates, but sticky in core goods.
Oxygen (Consumer Demand): Pending home sales only +0.8% y/y. Mortgage rates ~6.3%. Households cautious; grocery bills and medical costs weighing.
Mobility (Housing/Autos): Housing inventory rising, making it the “strongest buyer’s market in years.” Wholesale used car prices flat; repair costs up.
Circulation (Logistics/Tourism): Trucking spot rates subdued. Hotel RevPAR down in September, signaling softer travel demand.
Stress Test (Markets/Credit): HY spreads at ~2.7–2.8% (calm). VIX ~15–16. Equities still propped up by AI investment.
Doctor’s Notes
Diagnosis: Without AI spending, the economy would already look stagflationary. Growth is weak, prices sticky.
Symptoms: Fed cut 25 bps = short-term relief, long-term inflation risk. Trump’s H-1B EO curbs talent inflows, accelerating R&D migration abroad. Philanthropy softening and donor fatigue reduce community resilience.
Treatment Plan: Households: build cash, reduce leverage. Businesses: hedge supply chains, prepare for labor gaps. Policymakers: tariff relief and immigration clarity needed but unlikely.
Risk Factors: Expanded tariffs, AI investment slowdown, Fed credibility strain, housing inventory spike, sharper nonprofit pullback.
Composite Reading
Stagflation probability: 40%
Recession probability: 25%
Neither (slow but stable): 35%
Band: Elevated Risk
15 September 2025
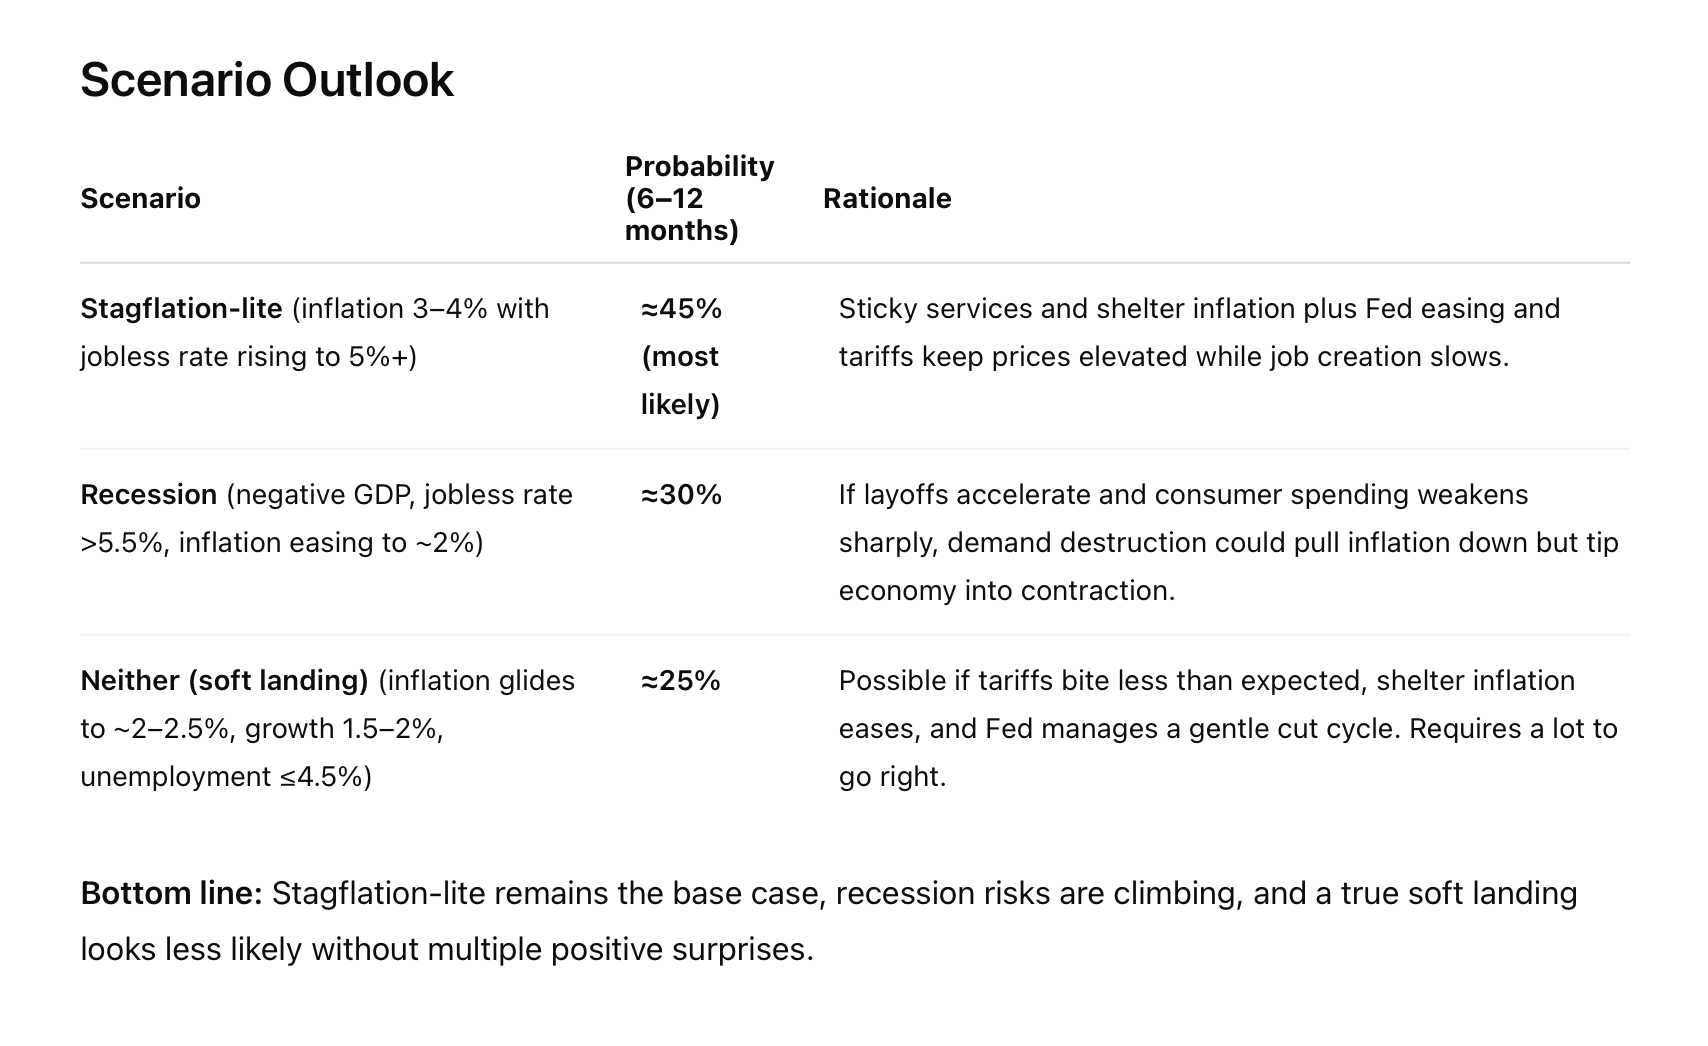
This week showed how fragile the economy feels beneath the surface: inflation is sticky, jobs are softening, and tourism and trade flows are weakening even as the Fed prepares to cut rates. The risk tilts toward stagflation-lite, with wobbles in labor, commodities, and global politics likely to ripple further into the holiday season.
Inflation remains sticky at just under 3 percent and shelter costs are still pushing higher. The labor market is softening more quickly than official headlines suggest, with payroll growth almost stalling and unemployment creeping up to 4.3 percent. Black unemployment surged to 7.5 percent, a reminder that downturns rarely hit evenly. Long-term joblessness is rising too, a classic late-cycle marker.
On the demand side, consumer sentiment dropped to its lowest point in four months, with middle and lower income households leading the decline. Early holiday retail forecasts are already being revised down, suggesting households are tightening before peak spending season. Housing is showing faint signs of stability with supply at 4.6 months, but affordability remains stretched and mortgage rates above 6.5 percent continue to bite. Commercial real estate remains the largest structural red flag, with office delinquencies above 7 percent.
Major headlines also shaped sentiment. Reports that the U.S. and China have reached a “framework” deal on TikTok lifted markets briefly, but details remain thin and Beijing has not confirmed. At the same time, pressure on the Fed to cut rates appears to have succeeded, with a decision expected this week. That raises the risk of easing into sticky inflation, a classic stagflation trap. Meanwhile, agriculture and trade remain stressed: China has not purchased any U.S. soybeans for the new crop year, pushing cash prices below $9 per bushel in some regions, and U.S. timber exports continue to weaken as Chinese demand for hardwood furniture slows. In labor-intensive manufacturing, the DHS raid at the Kia battery plant in Georgia, where hundreds of South Korean workers were arrested, has rattled investment confidence in advanced manufacturing projects. Tourism in D.C. and Chicago is also showing signs of strain amid political rhetoric and security crackdowns. Tourism to the US is down about $12B from last year, and a drag on the GDP of .1-.2 percentage points by itself.
Other important headlines that will factor into our economic reporting: Bolsonaro’s conviction could spark new economic fighting with Brazil. Brazil is already set up to provide China with soybeans and beef to counter the US market. On top of that India and China are straightening their relationships after Trump’s tariffs have fractured US/India relations. They are the 4th and 10th largest economies respectively.
Looking ahead, markets are focused on the Fed’s policy meeting midweek. Jobless claims will offer an early signal of whether layoffs are broadening. Housing starts and permits at week’s end will show whether builders still see demand in the face of high rates. And PCE inflation later this month will test whether the Fed’s preferred measure is cooling enough to justify more than one rate cut.
The balance of risks continues to tilt toward stagflation-lite: growth flat, jobs weaker, inflation sticky. But a sharper downturn cannot be ruled out if labor weakness deepens and consumers retreat further into the holidays.
Quick-Read Dashboard
Inflation (CPI, YoY): 2.7% | Core (YoY): 3.1% | 1-month: +0.2%
Unemployment rate: 4.3%
Nonfarm Payrolls (Aug): +22k — weakest pace outside recessions
Fed funds target range: 4.25–4.50% (cut expected imminently)
GDPNow (Q3 real growth nowcast): ~2.0%
Manufacturing PMI (ISM): 48.9 (contraction)
Composite PMI (S&P Global): 54.6 (expansion)
10y–2y Treasury spread: ~+0.6% (no longer inverted, but flat)
High-Yield credit spread (HY OAS): ~2.9% (tight)
30-yr mortgage (Freddie Mac): 6.58%
Existing-home sales (SAAR): 4.01M, months’ supply 4.6
Housing starts (SAAR): 1.43M (single-family ~0.94M)
CRE stress: CMBS delinquency elevated (esp. office)


New Relevant Statistics to Track / Add Moving Forward
Long‑term unemployment, especially 27‑plus weeks, as % of total unemployed. Already rising.
Consumer inflation expectations, especially among low and middle incomes. Recent rise to ~3.9% mentioned.
Job revisions and how much earlier estimates were overstated (e.g. over 900,000 jobs revised downward). This matters because policy and sentiment react to data reported, not revised.
Tightness in housing/rental supply and changes in “owners’ equivalent rent” or rent of primary residences inflation (lagging indicators).
Weekly initial jobless claims (national & local) as early warning.
Consumer sentiment / expectations indices (Michigan etc.).
Takeaway: Growth is fragile, inflation sticky, labor softening. Housing activity weak but stabilizing; CRE remains the deepest structural stress.
Sources: Bureau of Labor Statistics, Bureau of Economic Analysis, Federal Reserve, Atlanta Fed GDPNow, U.S. Census Bureau, NAR, MBA, Department of Labor, Treasury/FRED, ICE/BofA, S&P Global, ISM, University of Michigan, Conference Board, USDA, FAO, Trepp, Moody’s/Fitch/S&P, TSA, EIA, American Soybean Association, National Hardwood Lumber Association, Reuters, Bloomberg, WSJ, Financial Times, Politico, The Hill, NPR, AgWeb, Farm Policy News. Internal analytics: Stagflation Index, Structural Risk Index, Retirement Defense Checklist, Early House-Sale Triggers, Where Could We Land? Tracker.